Domain Coloring Basics
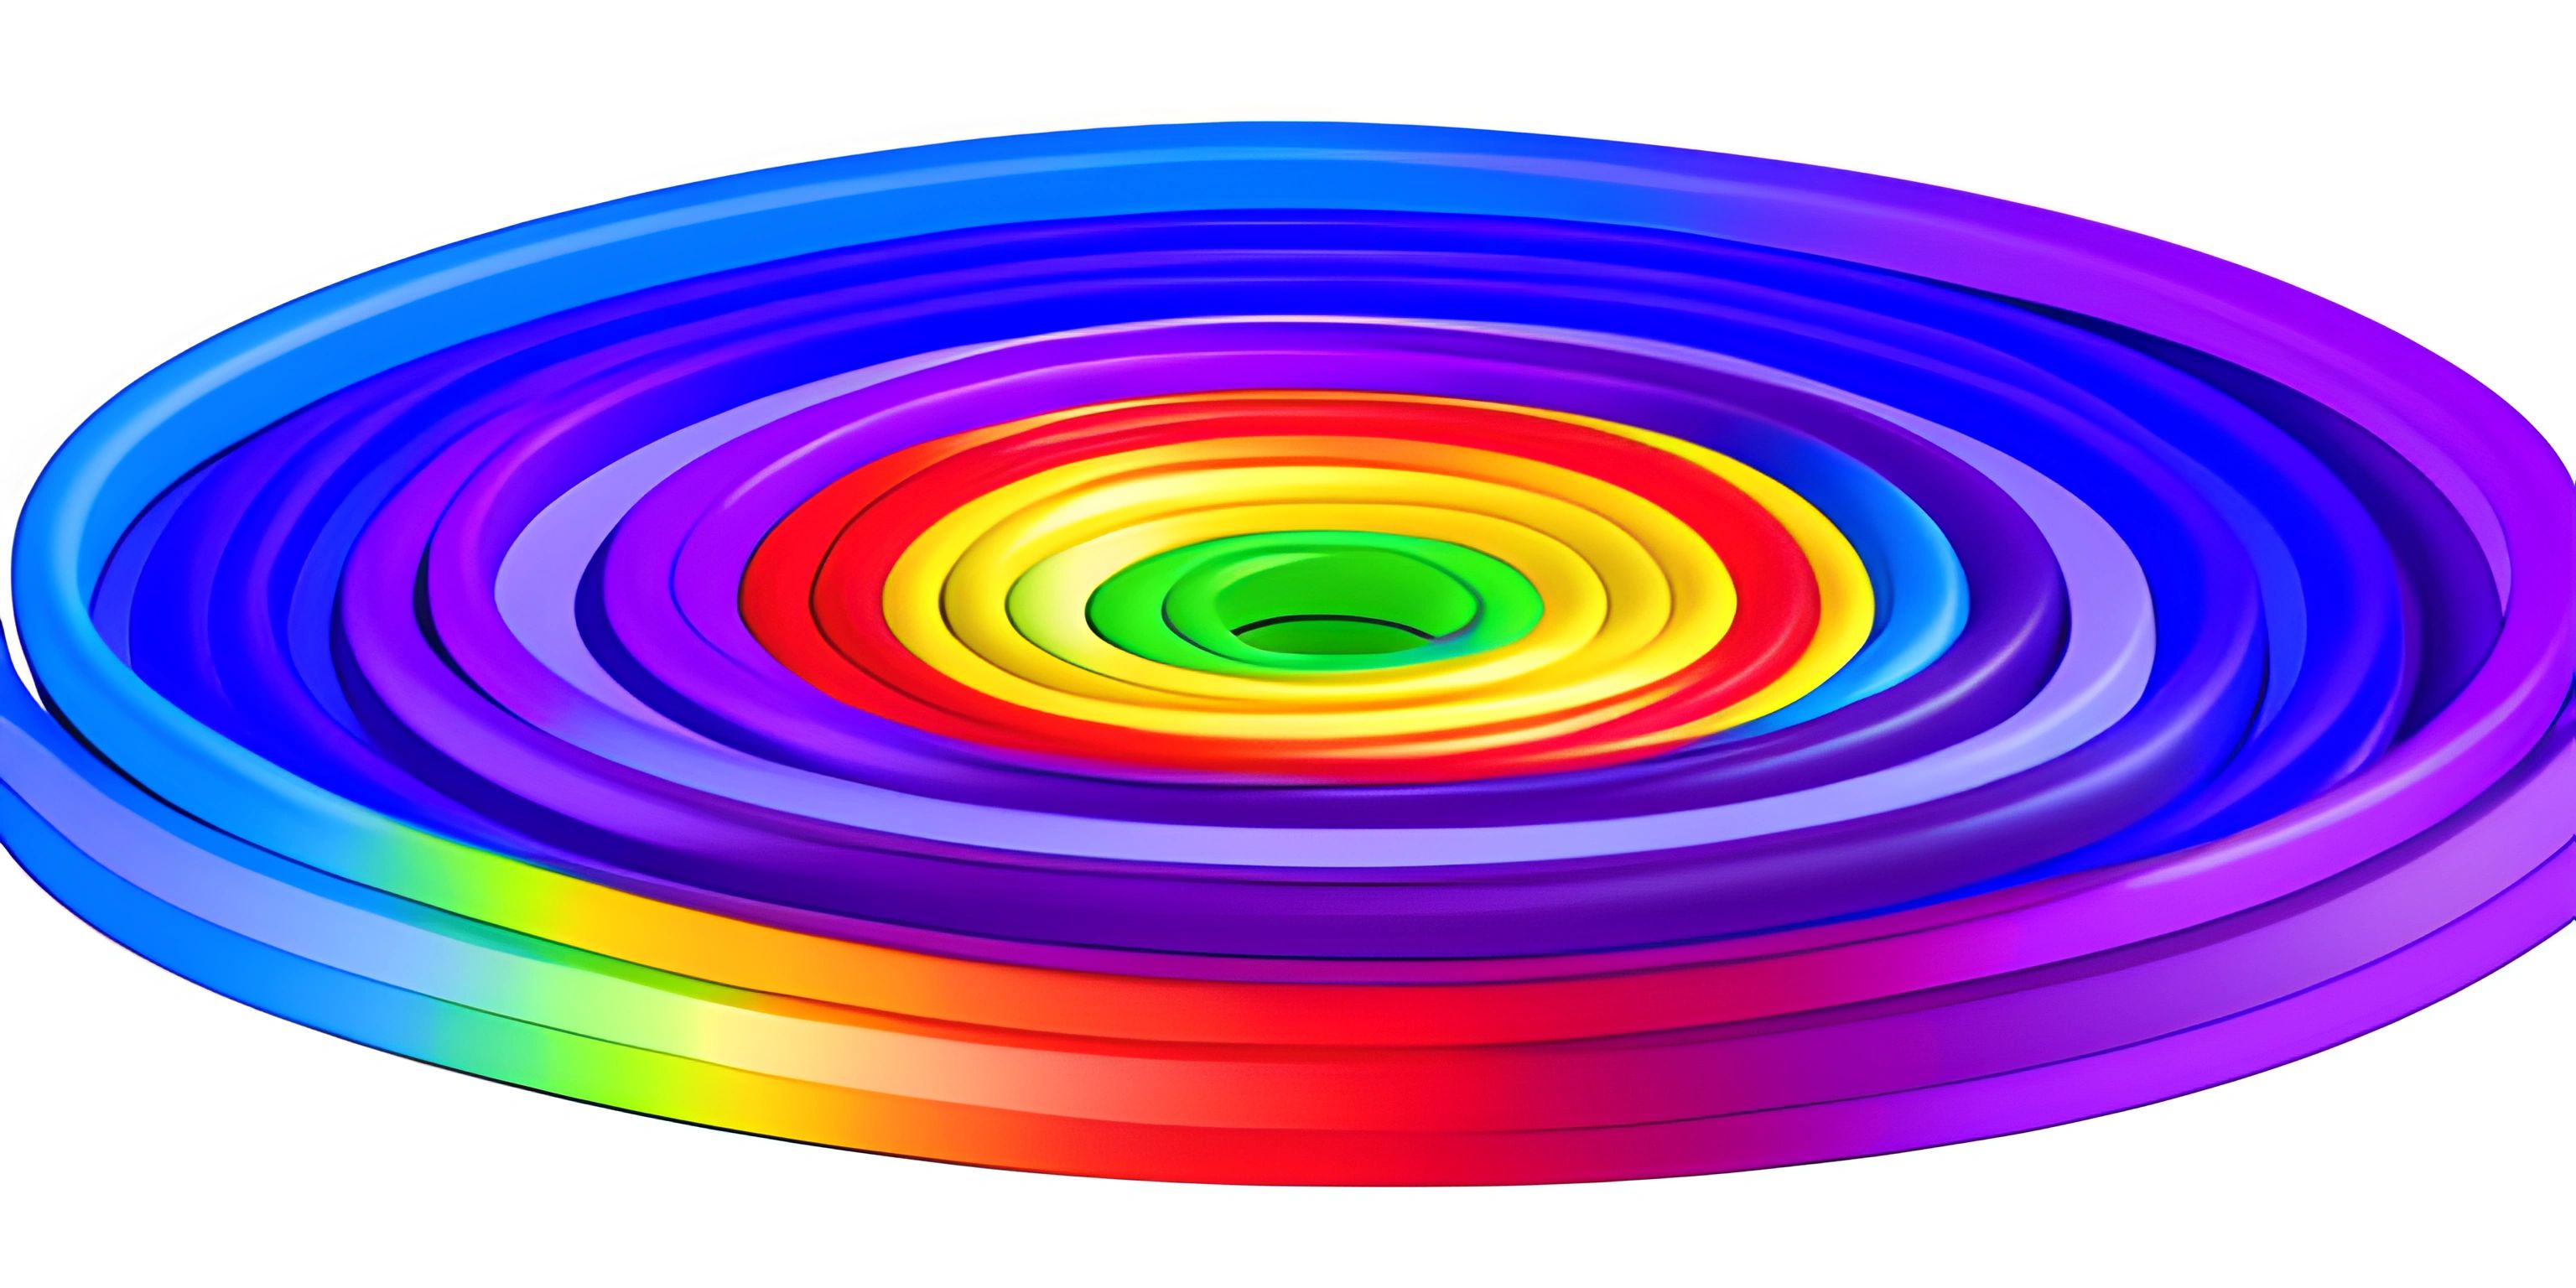
Note: this page has been created with the use of AI. Please take caution, and note that the content of this page does not necessarily reflect the opinion of Cratecode.
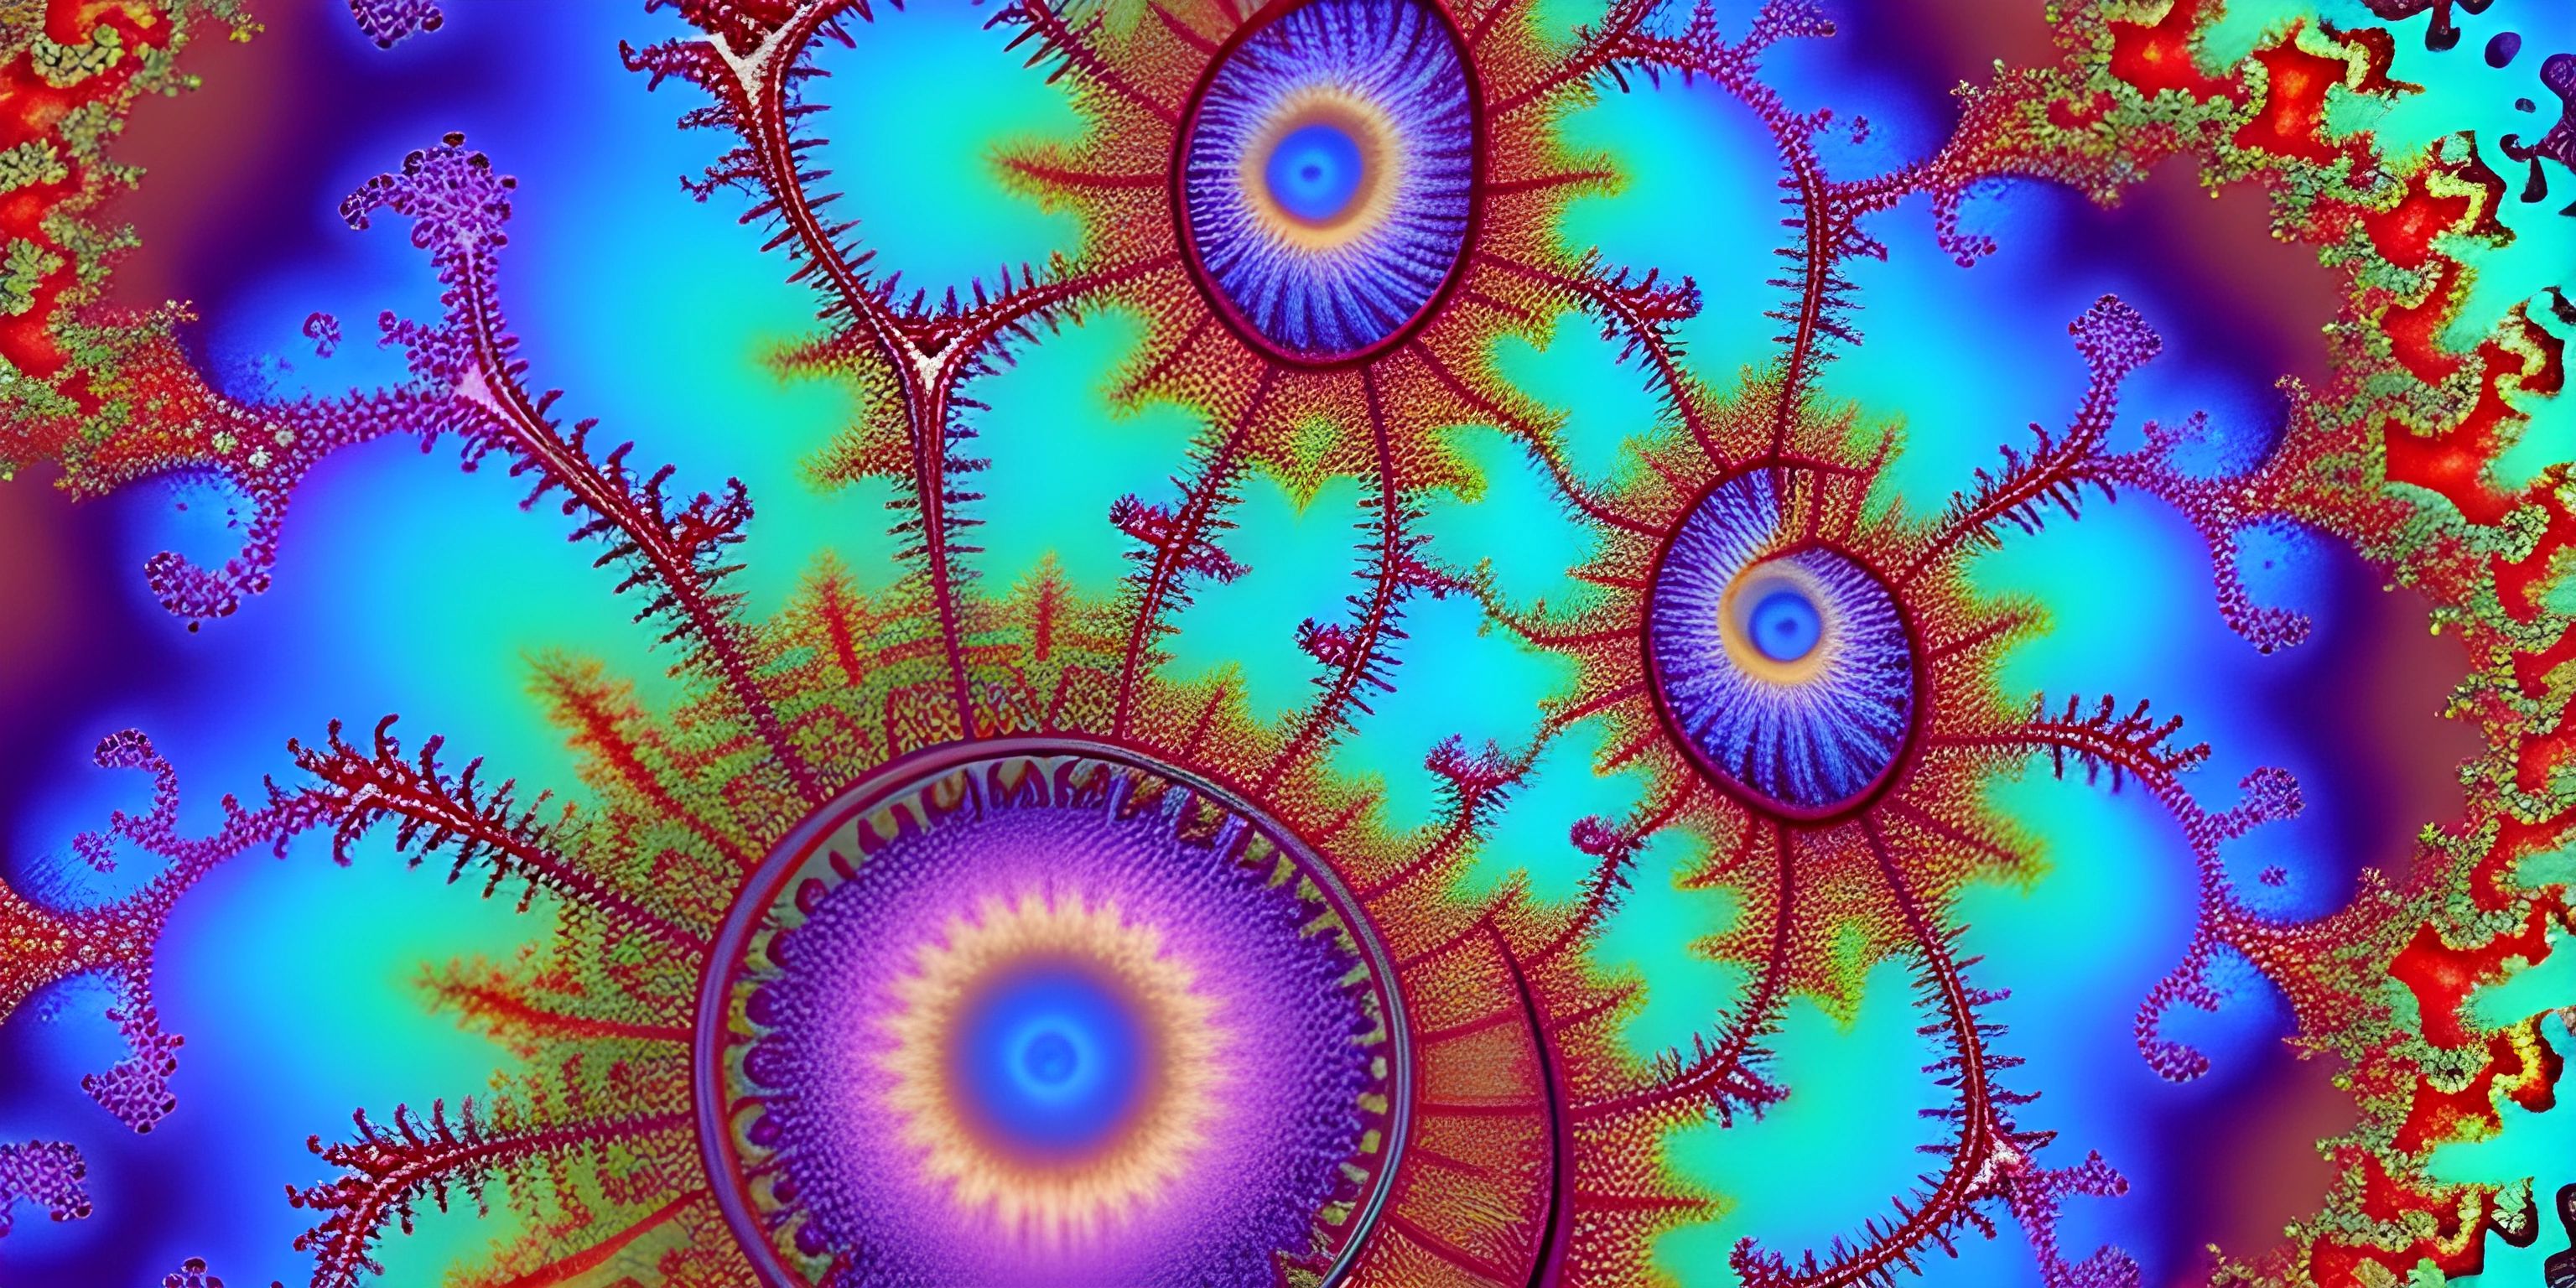
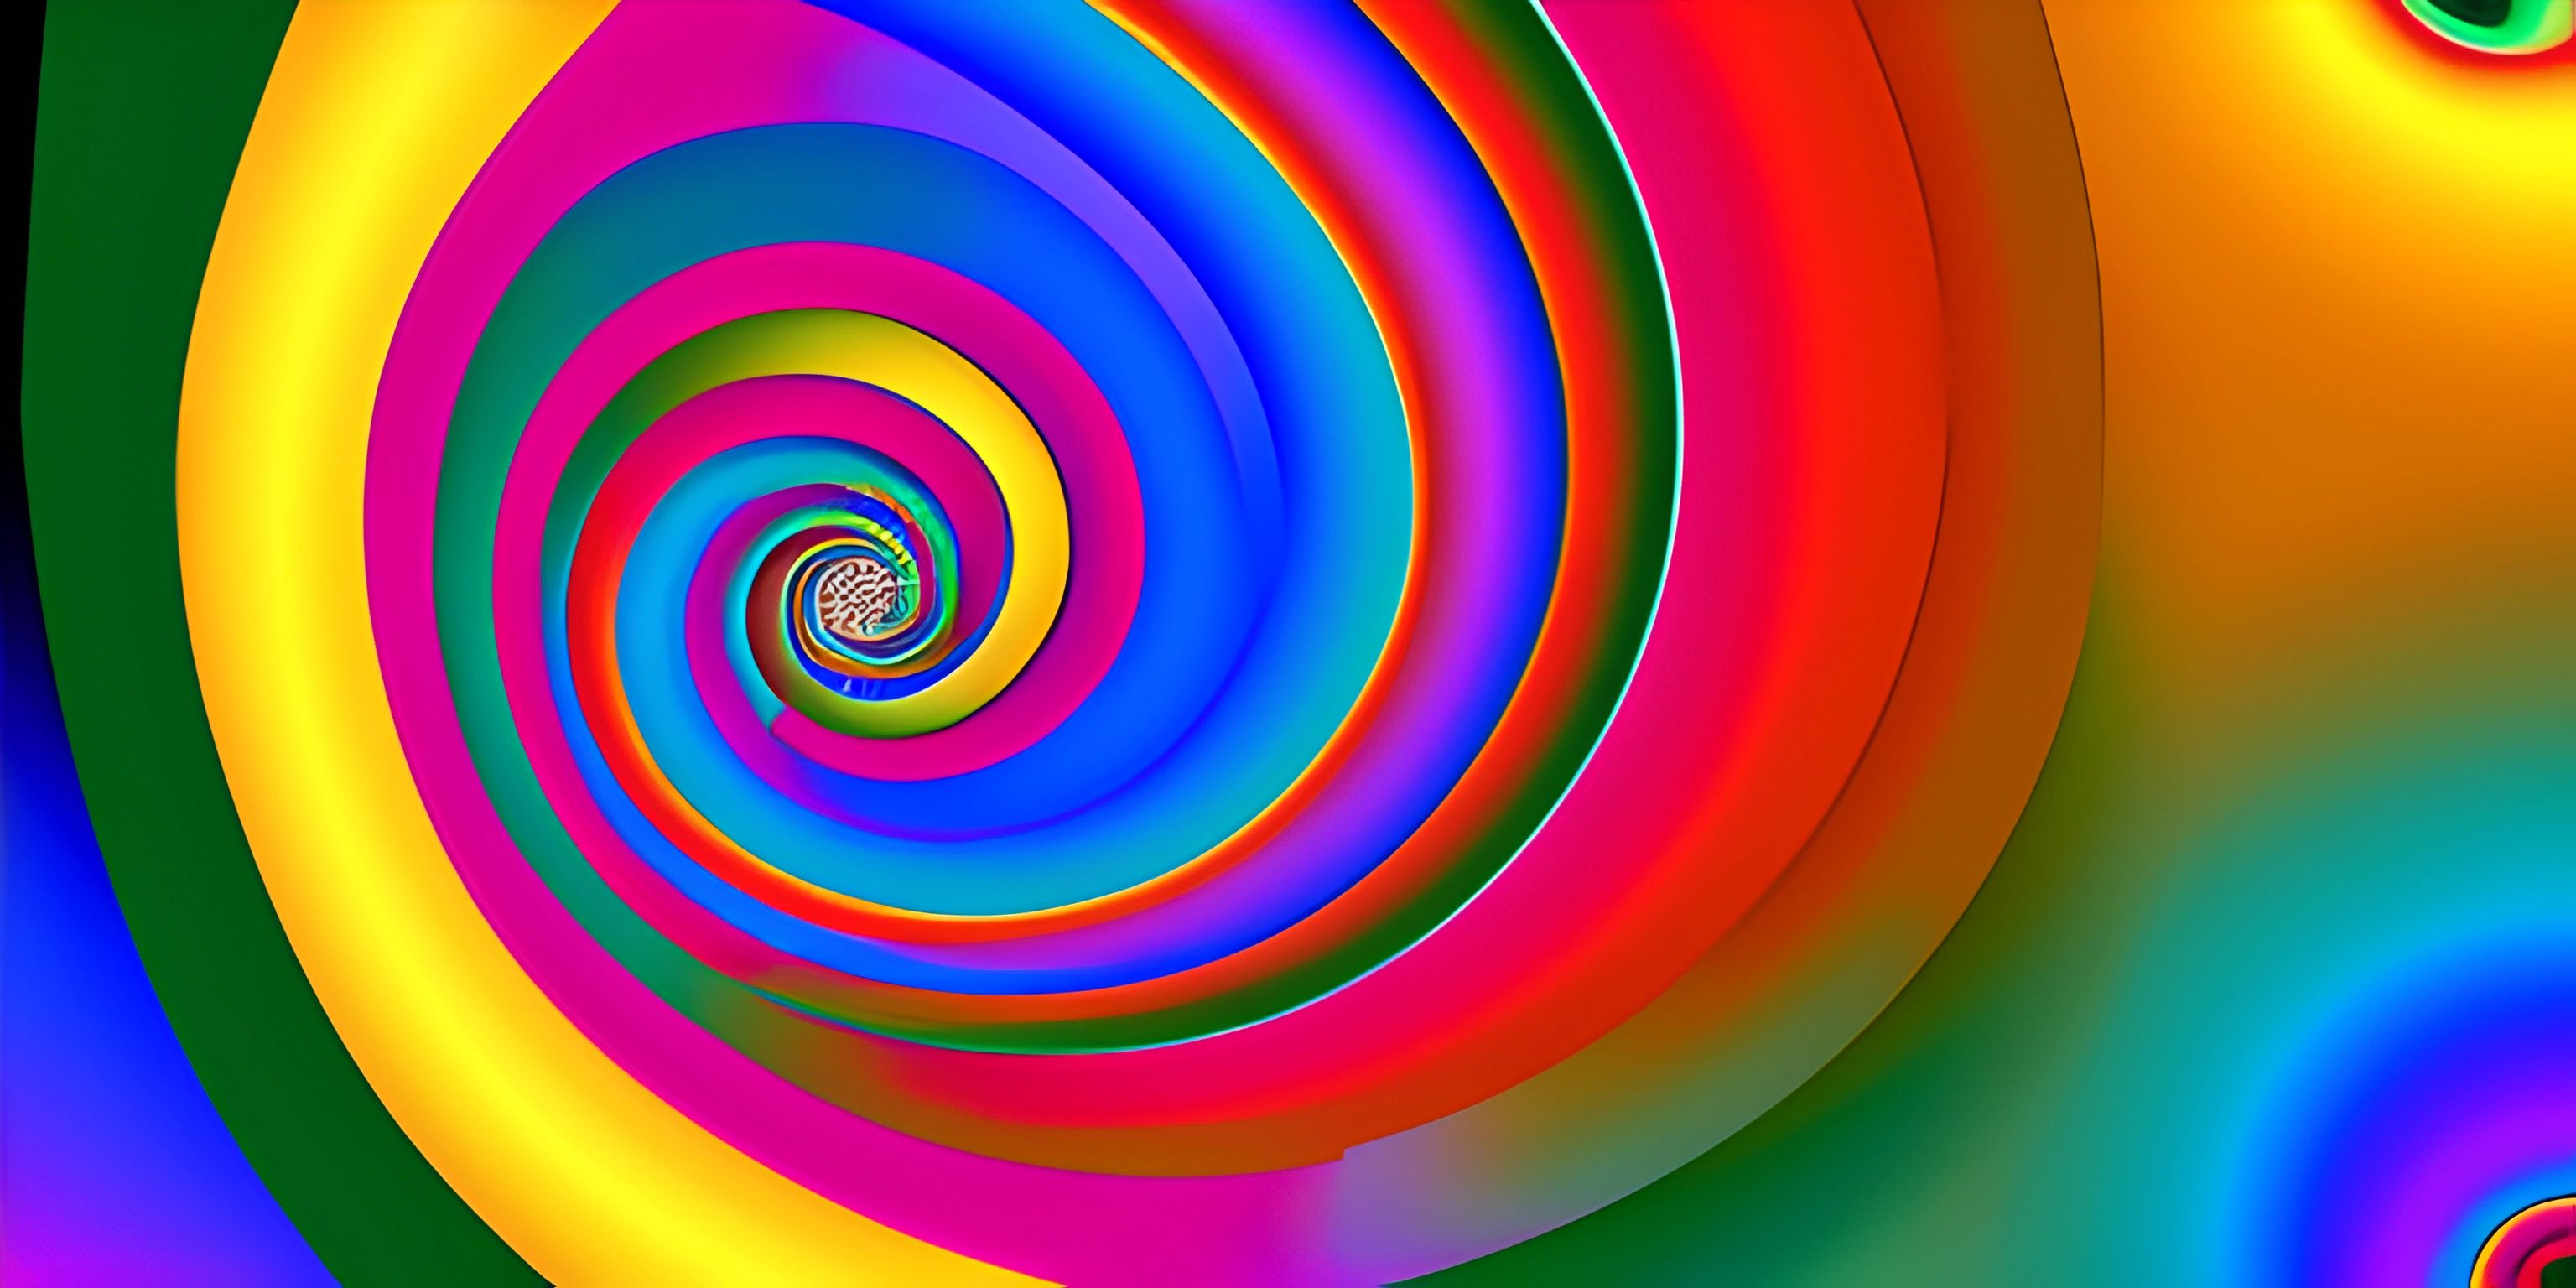
Domain coloring is a fascinating technique used to visualize complex mathematical functions, often producing mesmerizing and intricate patterns. These patterns have found their way into the world of generative art, where artists and programmers alike use their creativity to turn math into eye-catching masterpieces.
What is Domain Coloring?
Domain coloring is a technique used to visualize complex-valued functions — functions that map a complex number input to a complex number output. Since complex numbers have both real and imaginary components, visualizing their behavior can be tricky. Domain coloring assigns a unique color to each point in the complex plane based on the function's output at that point, creating a visual representation of the function's behavior.
Complex Numbers and Functions
In order to dive into domain coloring, we need to have a basic understanding of complex numbers and complex-valued functions.
A complex number has the form a + bi, where a and b are real numbers and i is the imaginary unit, which has the property that i^2 = -1. Complex numbers can be represented as points in a plane, known as the complex plane, with the real part (a) along the horizontal axis and the imaginary part (b) along the vertical axis.
Complex-valued functions take complex numbers as input and produce complex numbers as output. They play an important role in mathematics and have many practical applications in areas such as signal processing, fluid dynamics, and control theory.
The Color Mapping
The key to domain coloring is mapping the output of a complex-valued function to a color. This is typically done using the function's output's polar coordinates — the magnitude and argument (or angle) of the complex number. Then, these polar coordinates are used to assign a color, often with the magnitude controlling the brightness or saturation and the argument controlling the hue.
For example, let's consider the function f(z) = z^2. To visualize this function using domain coloring, we would go through the following steps:
- Choose a point
zin the complex plane. - Compute the output of the function,
w = f(z). - Convert
wto polar coordinates,(r, θ). - Assign a color to the point
zbased on(r, θ).
By repeating this process for many points, we can create a colorful image representing the behavior of the function.
Applying Domain Coloring in Generative Art
Domain coloring can be a powerful tool for creating generative art, as it allows for the exploration of intricate patterns and shapes emerging from the complex functions. With the help of programming languages and libraries such as Python and Matplotlib, you can create stunning visualizations based on domain coloring.
Here's a basic example of how to create a domain coloring visualization using Python and Matplotlib:
import numpy as np
import matplotlib.pyplot as plt
import matplotlib.cm as cm

def complex_function(z):
    return z**2

def domain_coloring(function, width, height):
    x = np.linspace(-2, 2, width)
    y = np.linspace(-2, 2, height)
    X, Y = np.meshgrid(x, y)
    Z = X + 1j * Y
    W = function(Z)
    magnitude = np.abs(W)
    angle = np.angle(W)
    hue = (angle + np.pi) / (2 * np.pi)
    img = cm.hsv(hue)
    return img

img = domain_coloring(complex_function, 800, 800)
plt.imshow(img)
plt.show()This code defines a complex-valued function complex_function(z) and a domain_coloring function that creates an image of the function using domain coloring. The result is a beautiful, mathematically-inspired piece of generative art.
Feel free to experiment with different functions, color maps, and settings to create your own unique domain coloring masterpieces. Happy coloring!
Hey there! Want to learn more? Cratecode is an online learning platform that lets you forge your own path. Click here to check out a lesson: Rust Color Mandelbrot Set (psst, it's free!).

