Cratecode
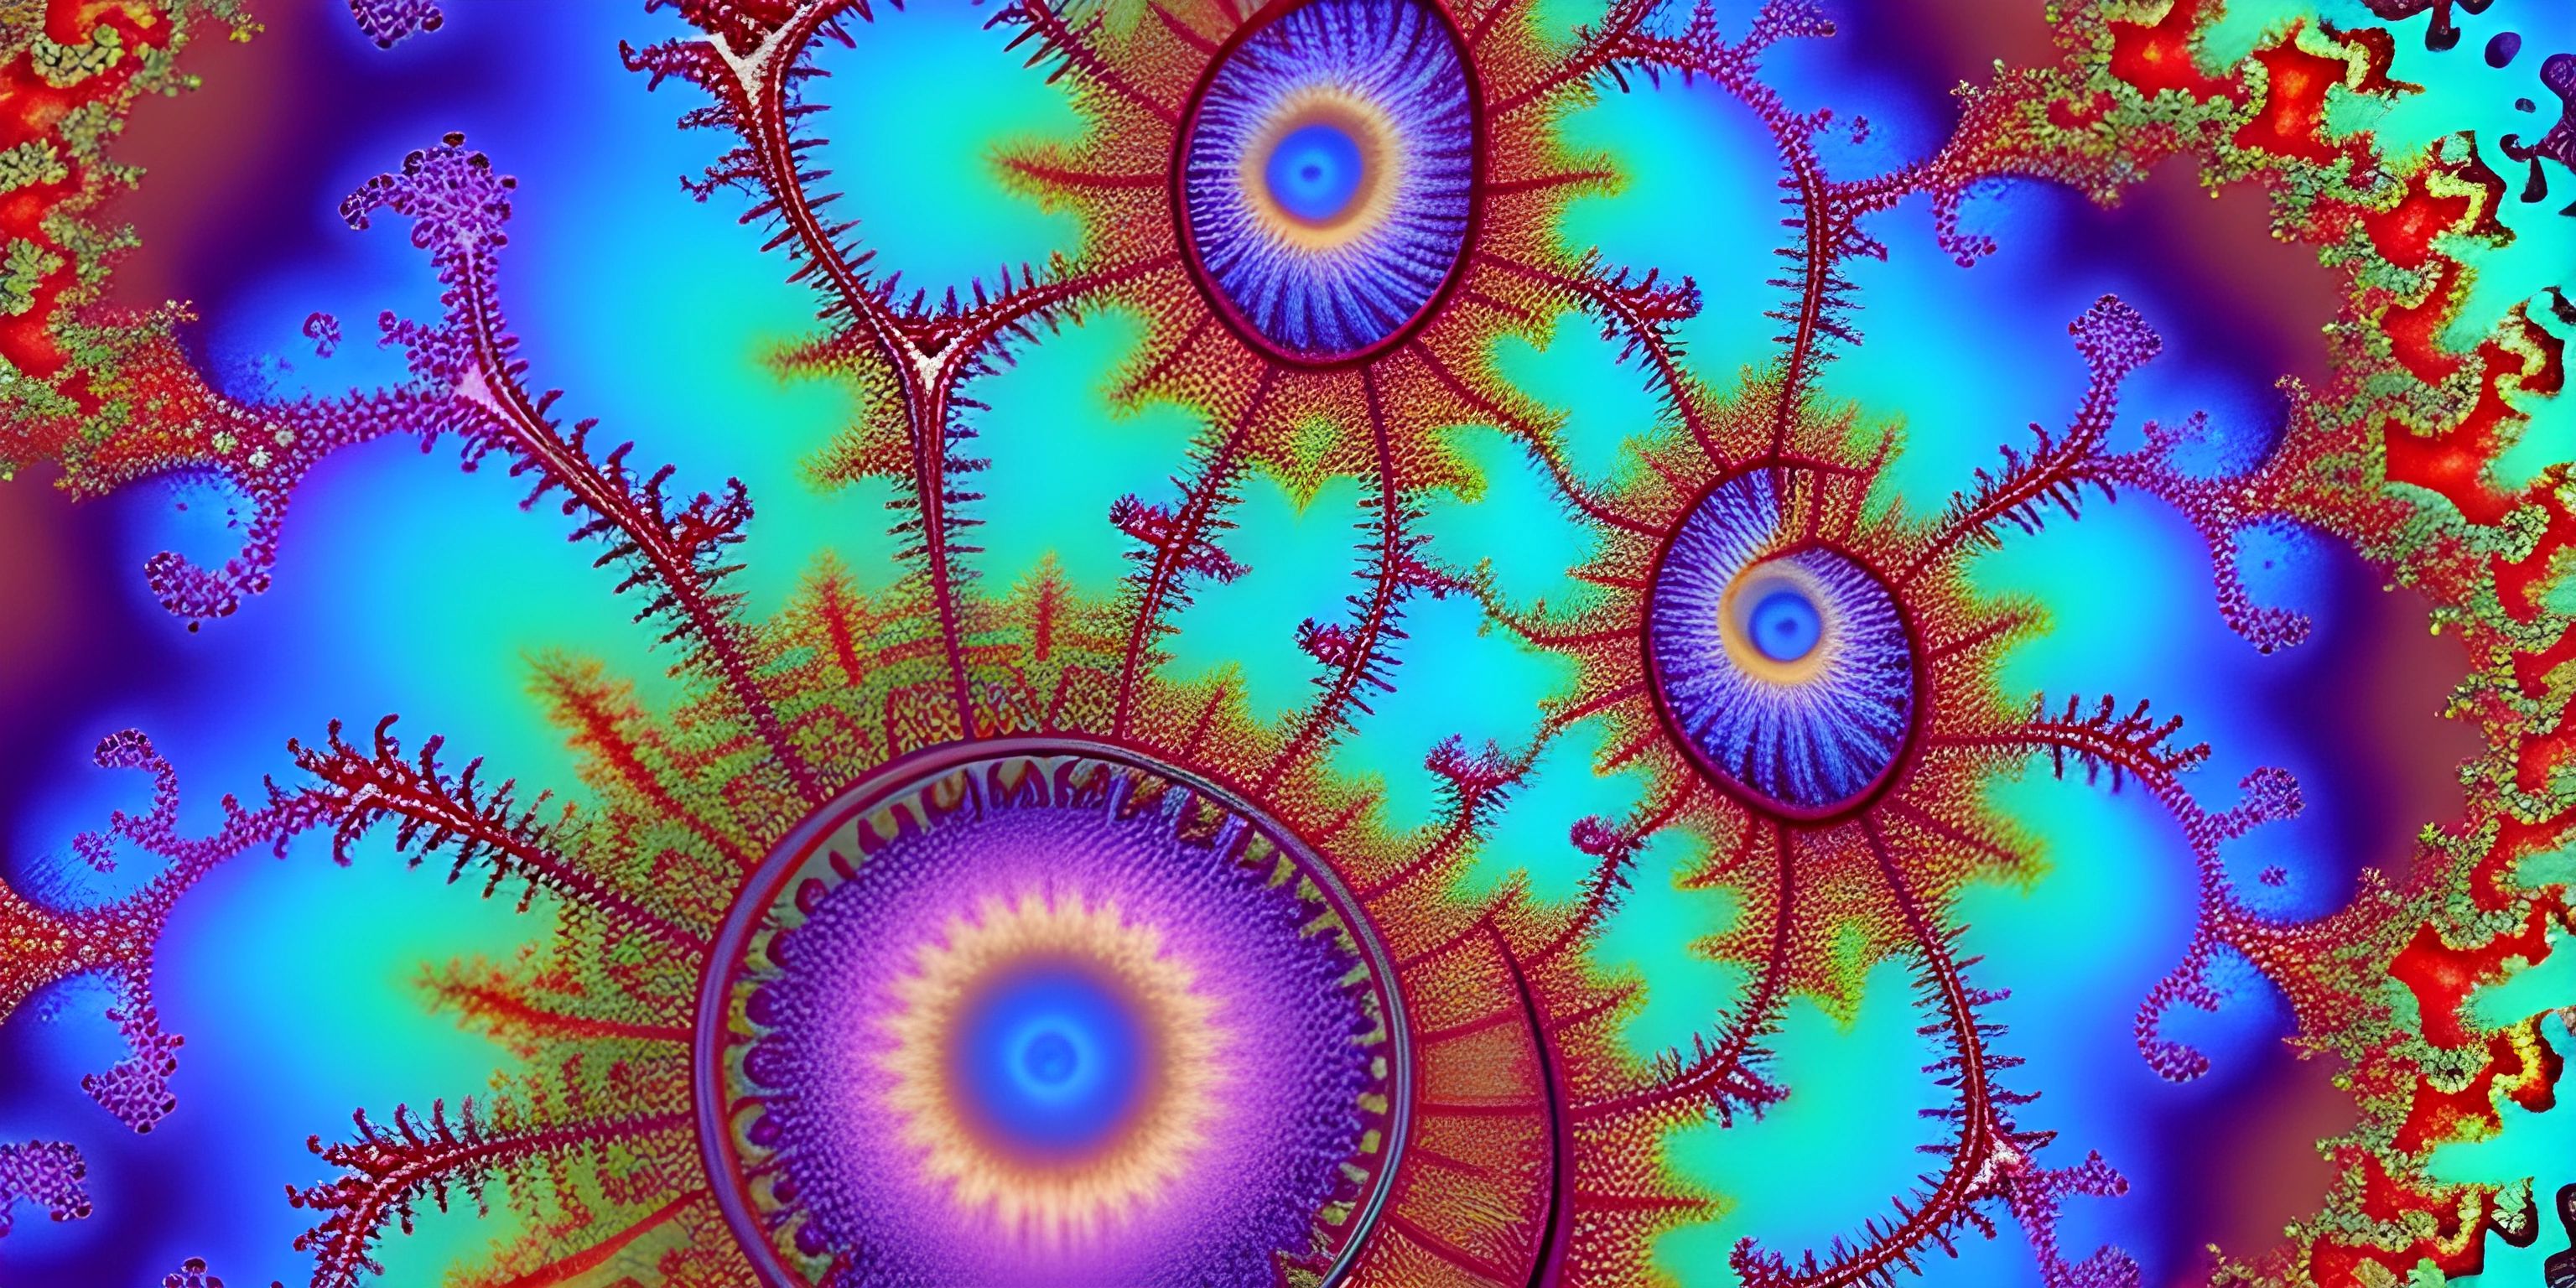
Explore the Mandelbrot Set, its significance in mathematics and computer science, and its mesmerizing visual properties.
Dive into the mesmerizing world of the Mandelbrot set and learn how to use it for creating stunning generative art pieces.
Learn how to create interactive sketches using py5, a Python interface to the Processing visualization framework.
An overview of p5.js features and how to use them for creative coding.
Learn how to create mesmerizing animations using the py5 library in Python. From basic shapes to complex movements, this guide covers it all.
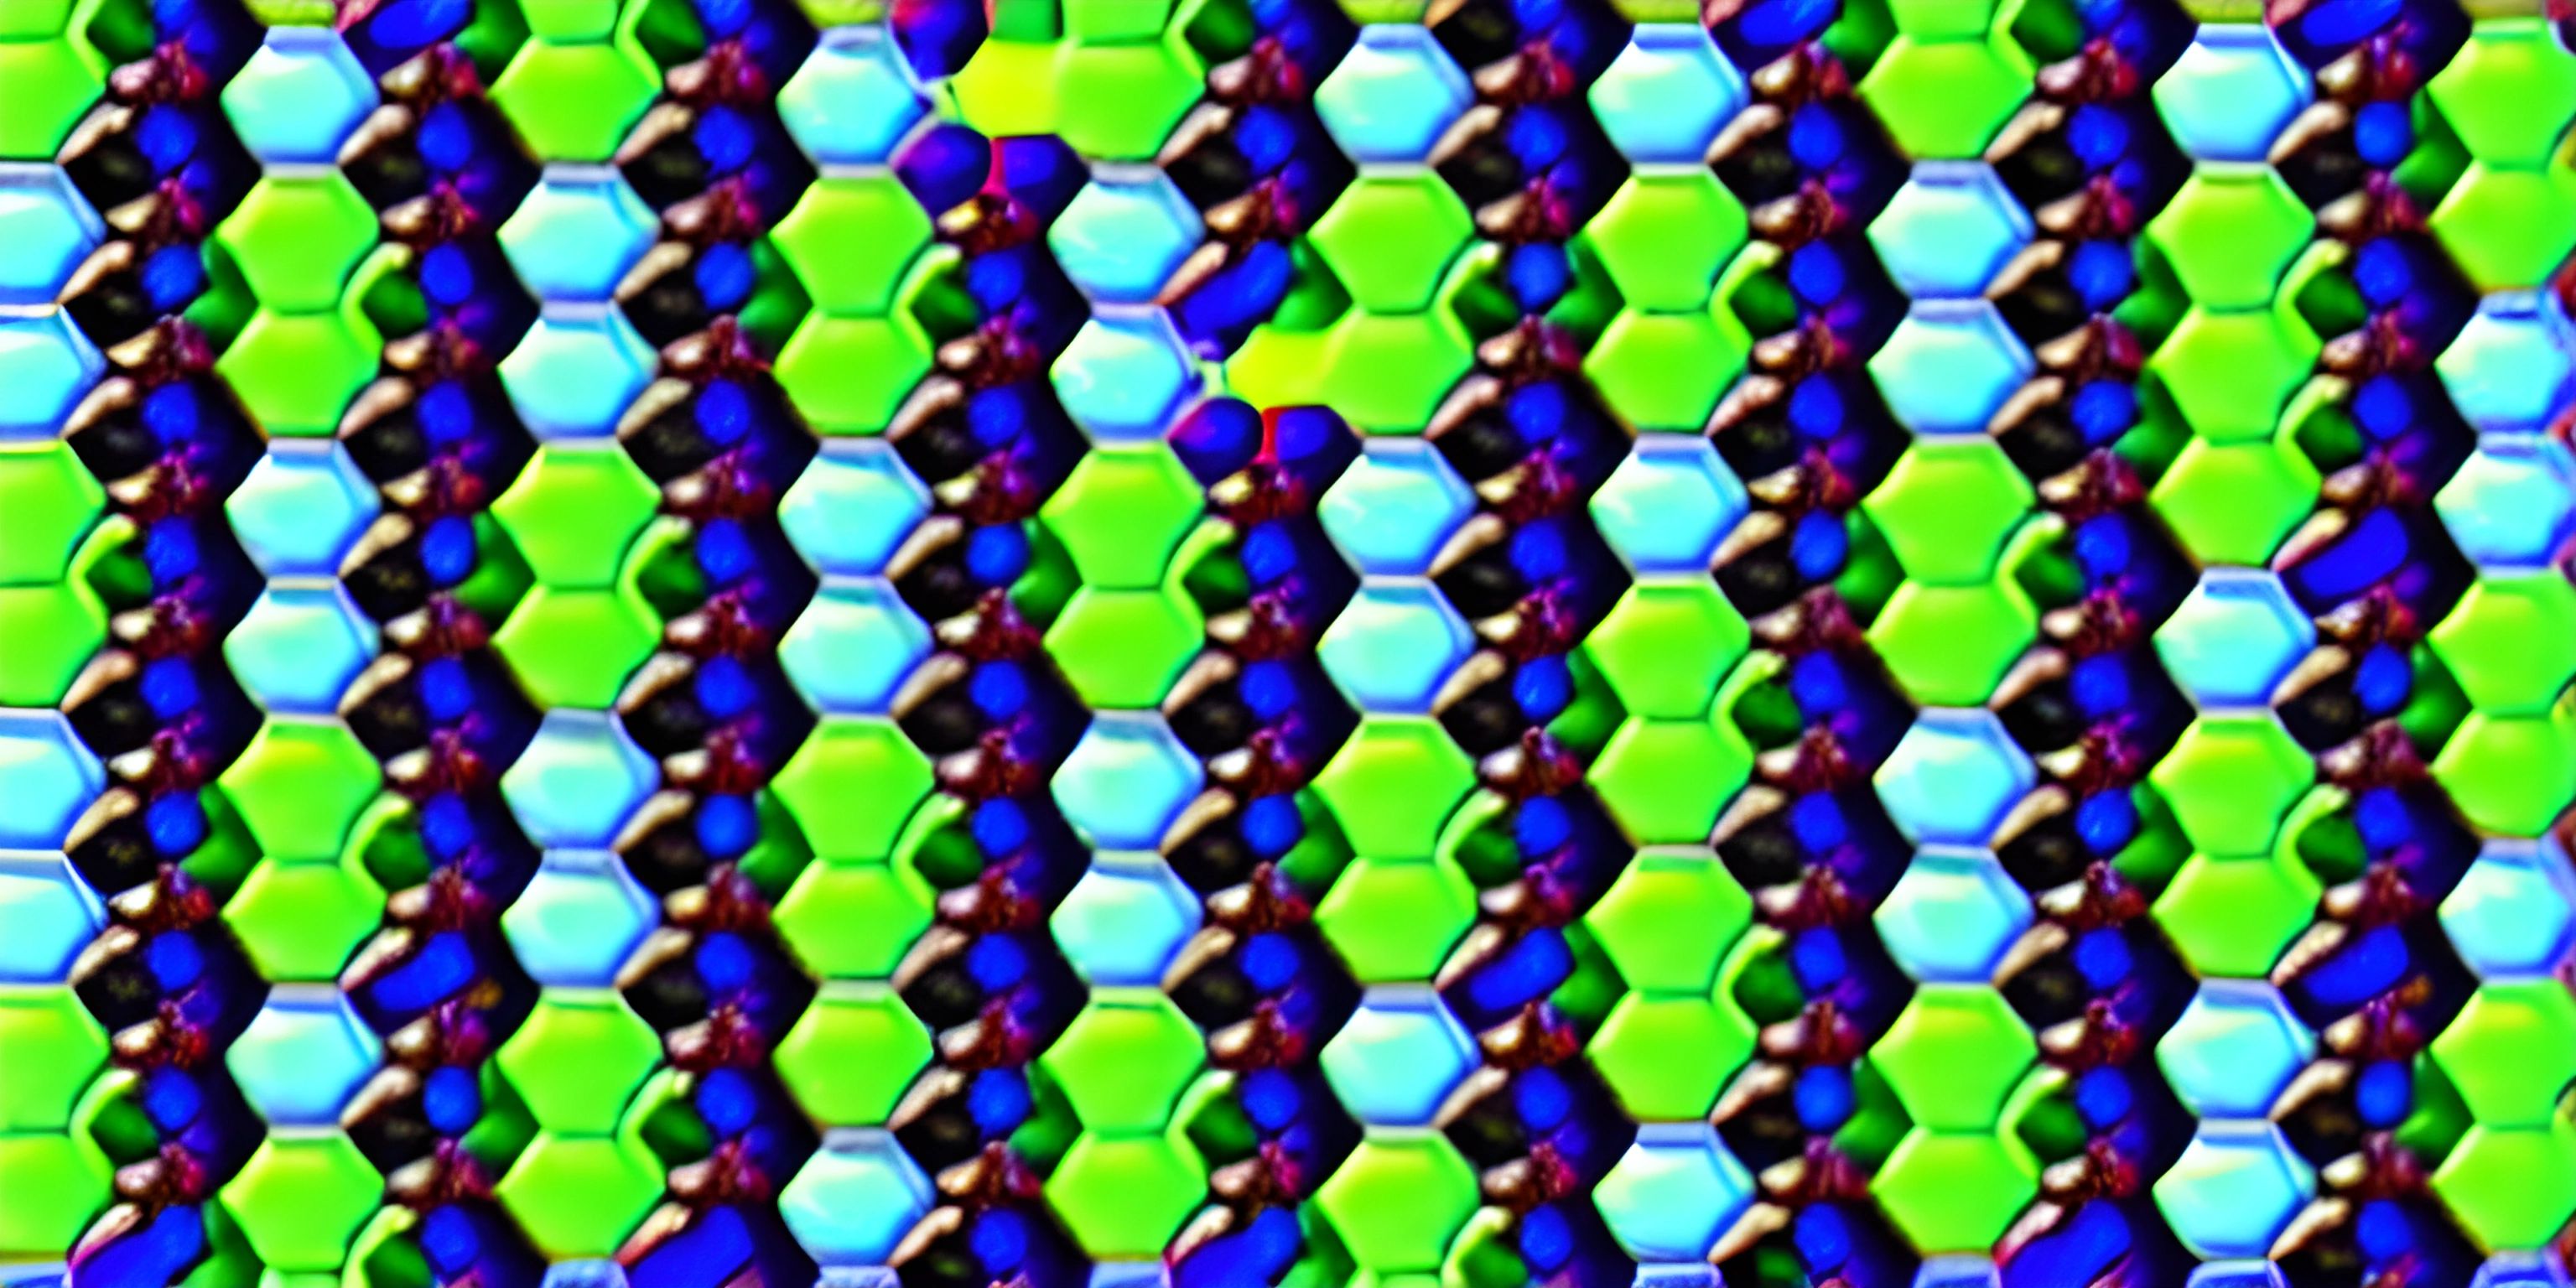
Explore Conway's Game of Life and how it can be used to create stunning generative art.
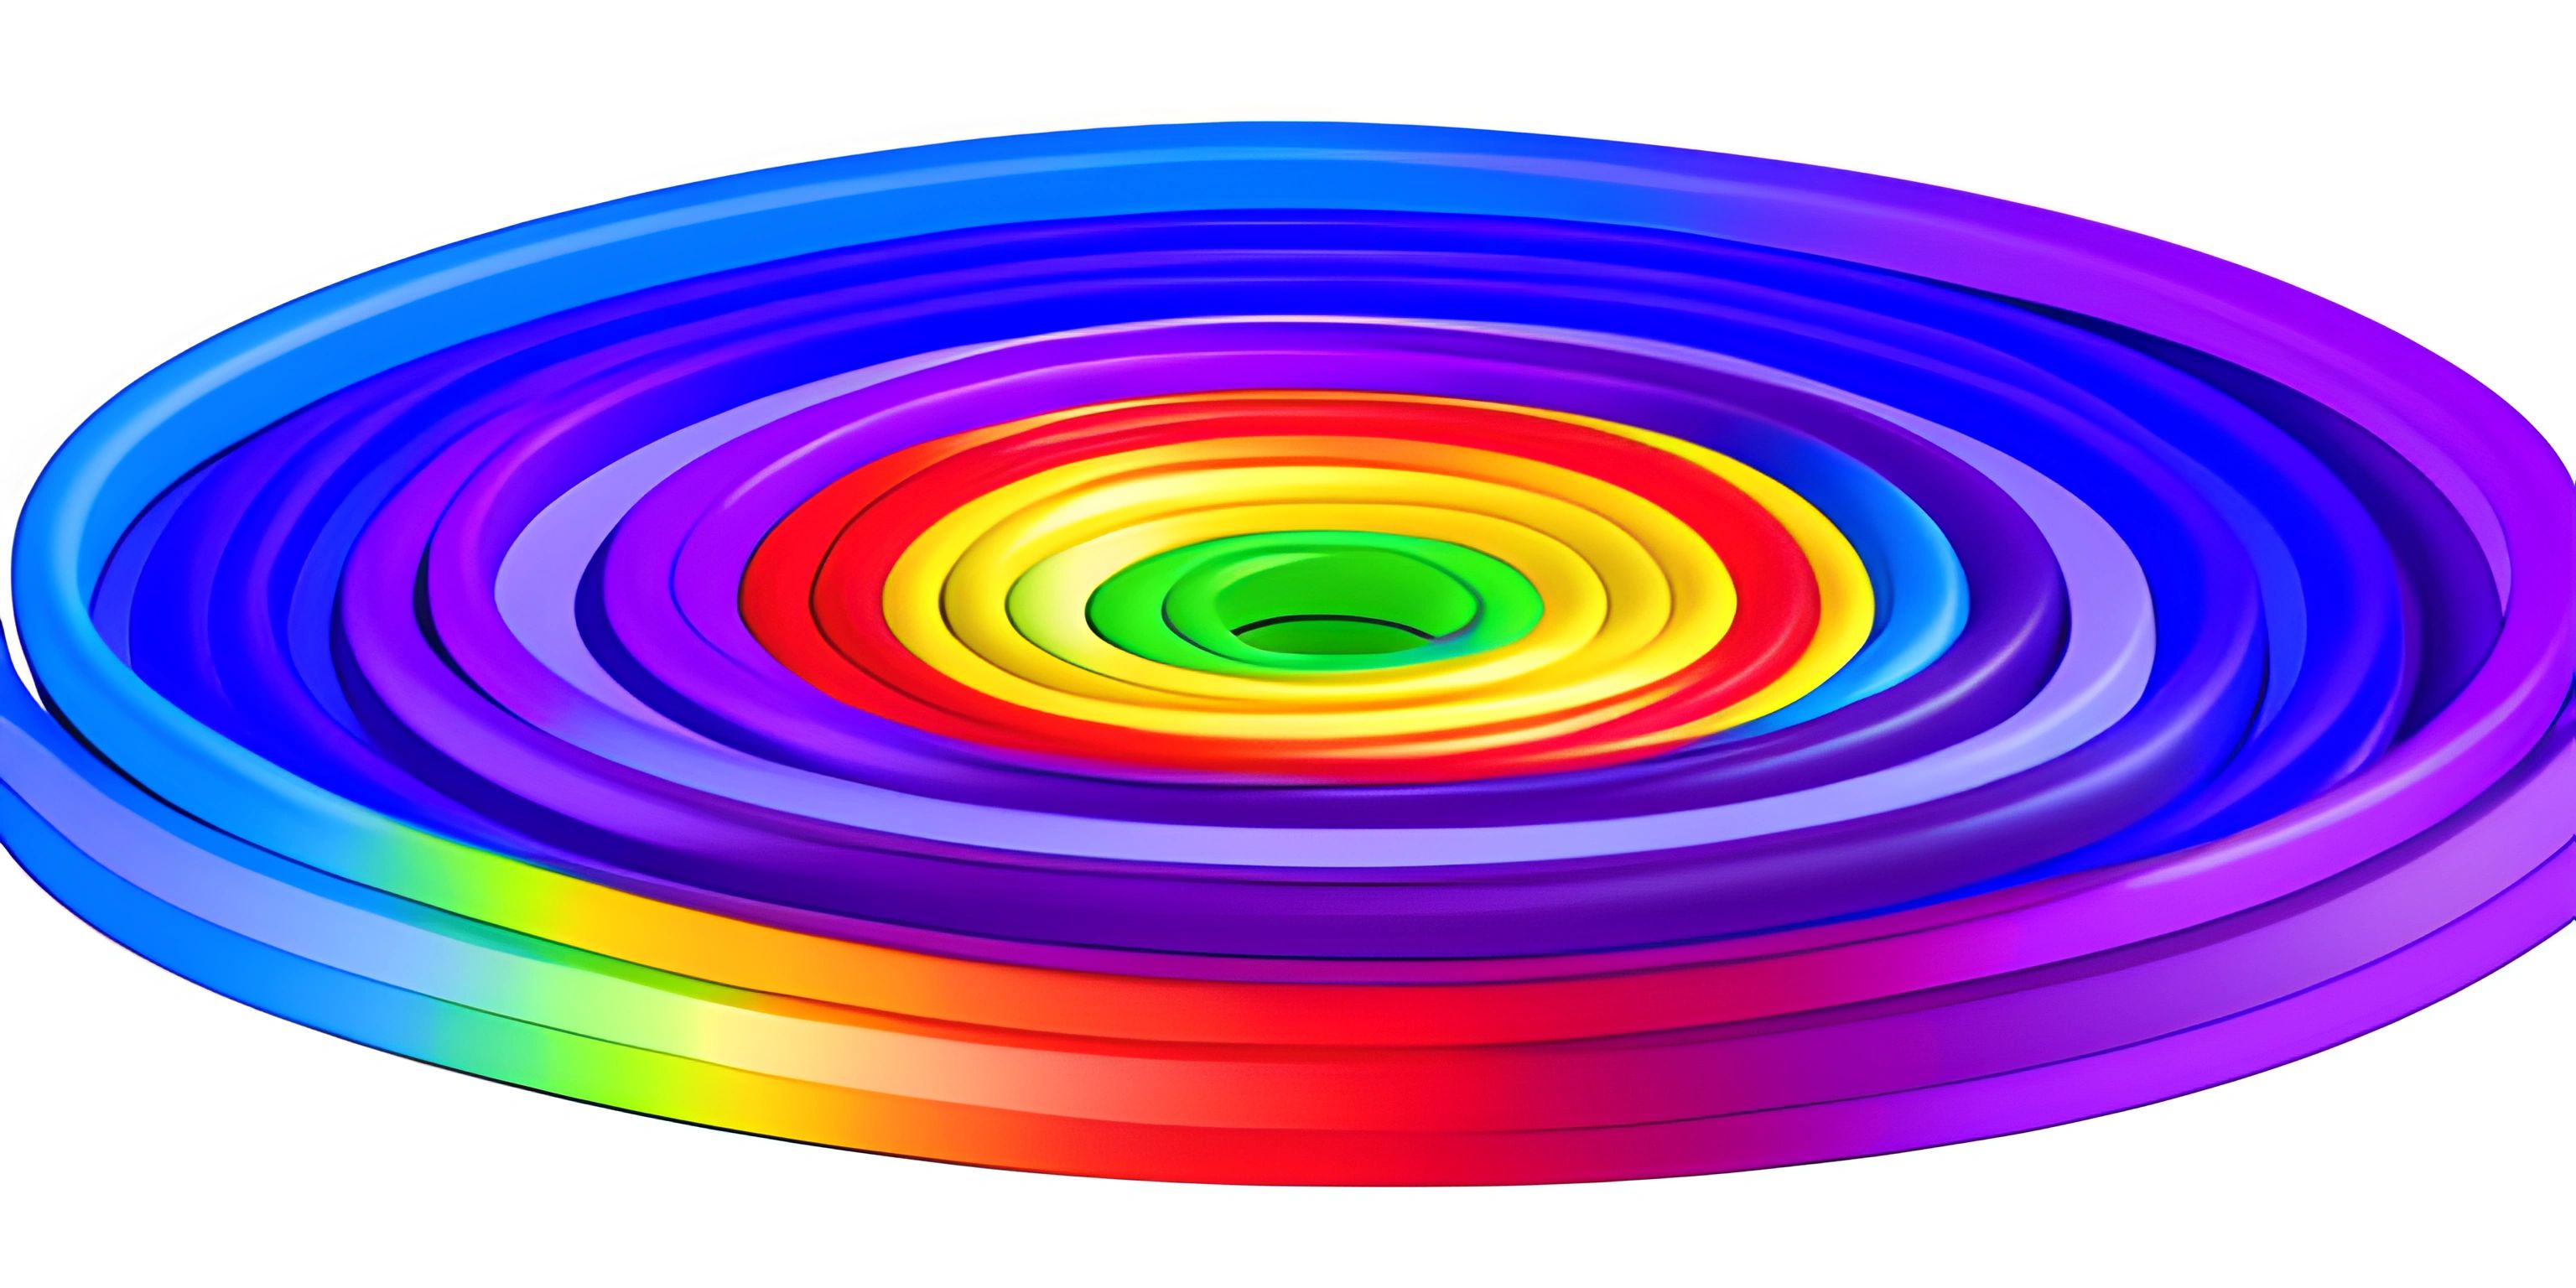
Understand the concept of domain coloring and learn how to apply it in generative art.
Learn how to visualize complex functions with domain coloring, a technique that uses color to represent the output of a function in the complex plane.
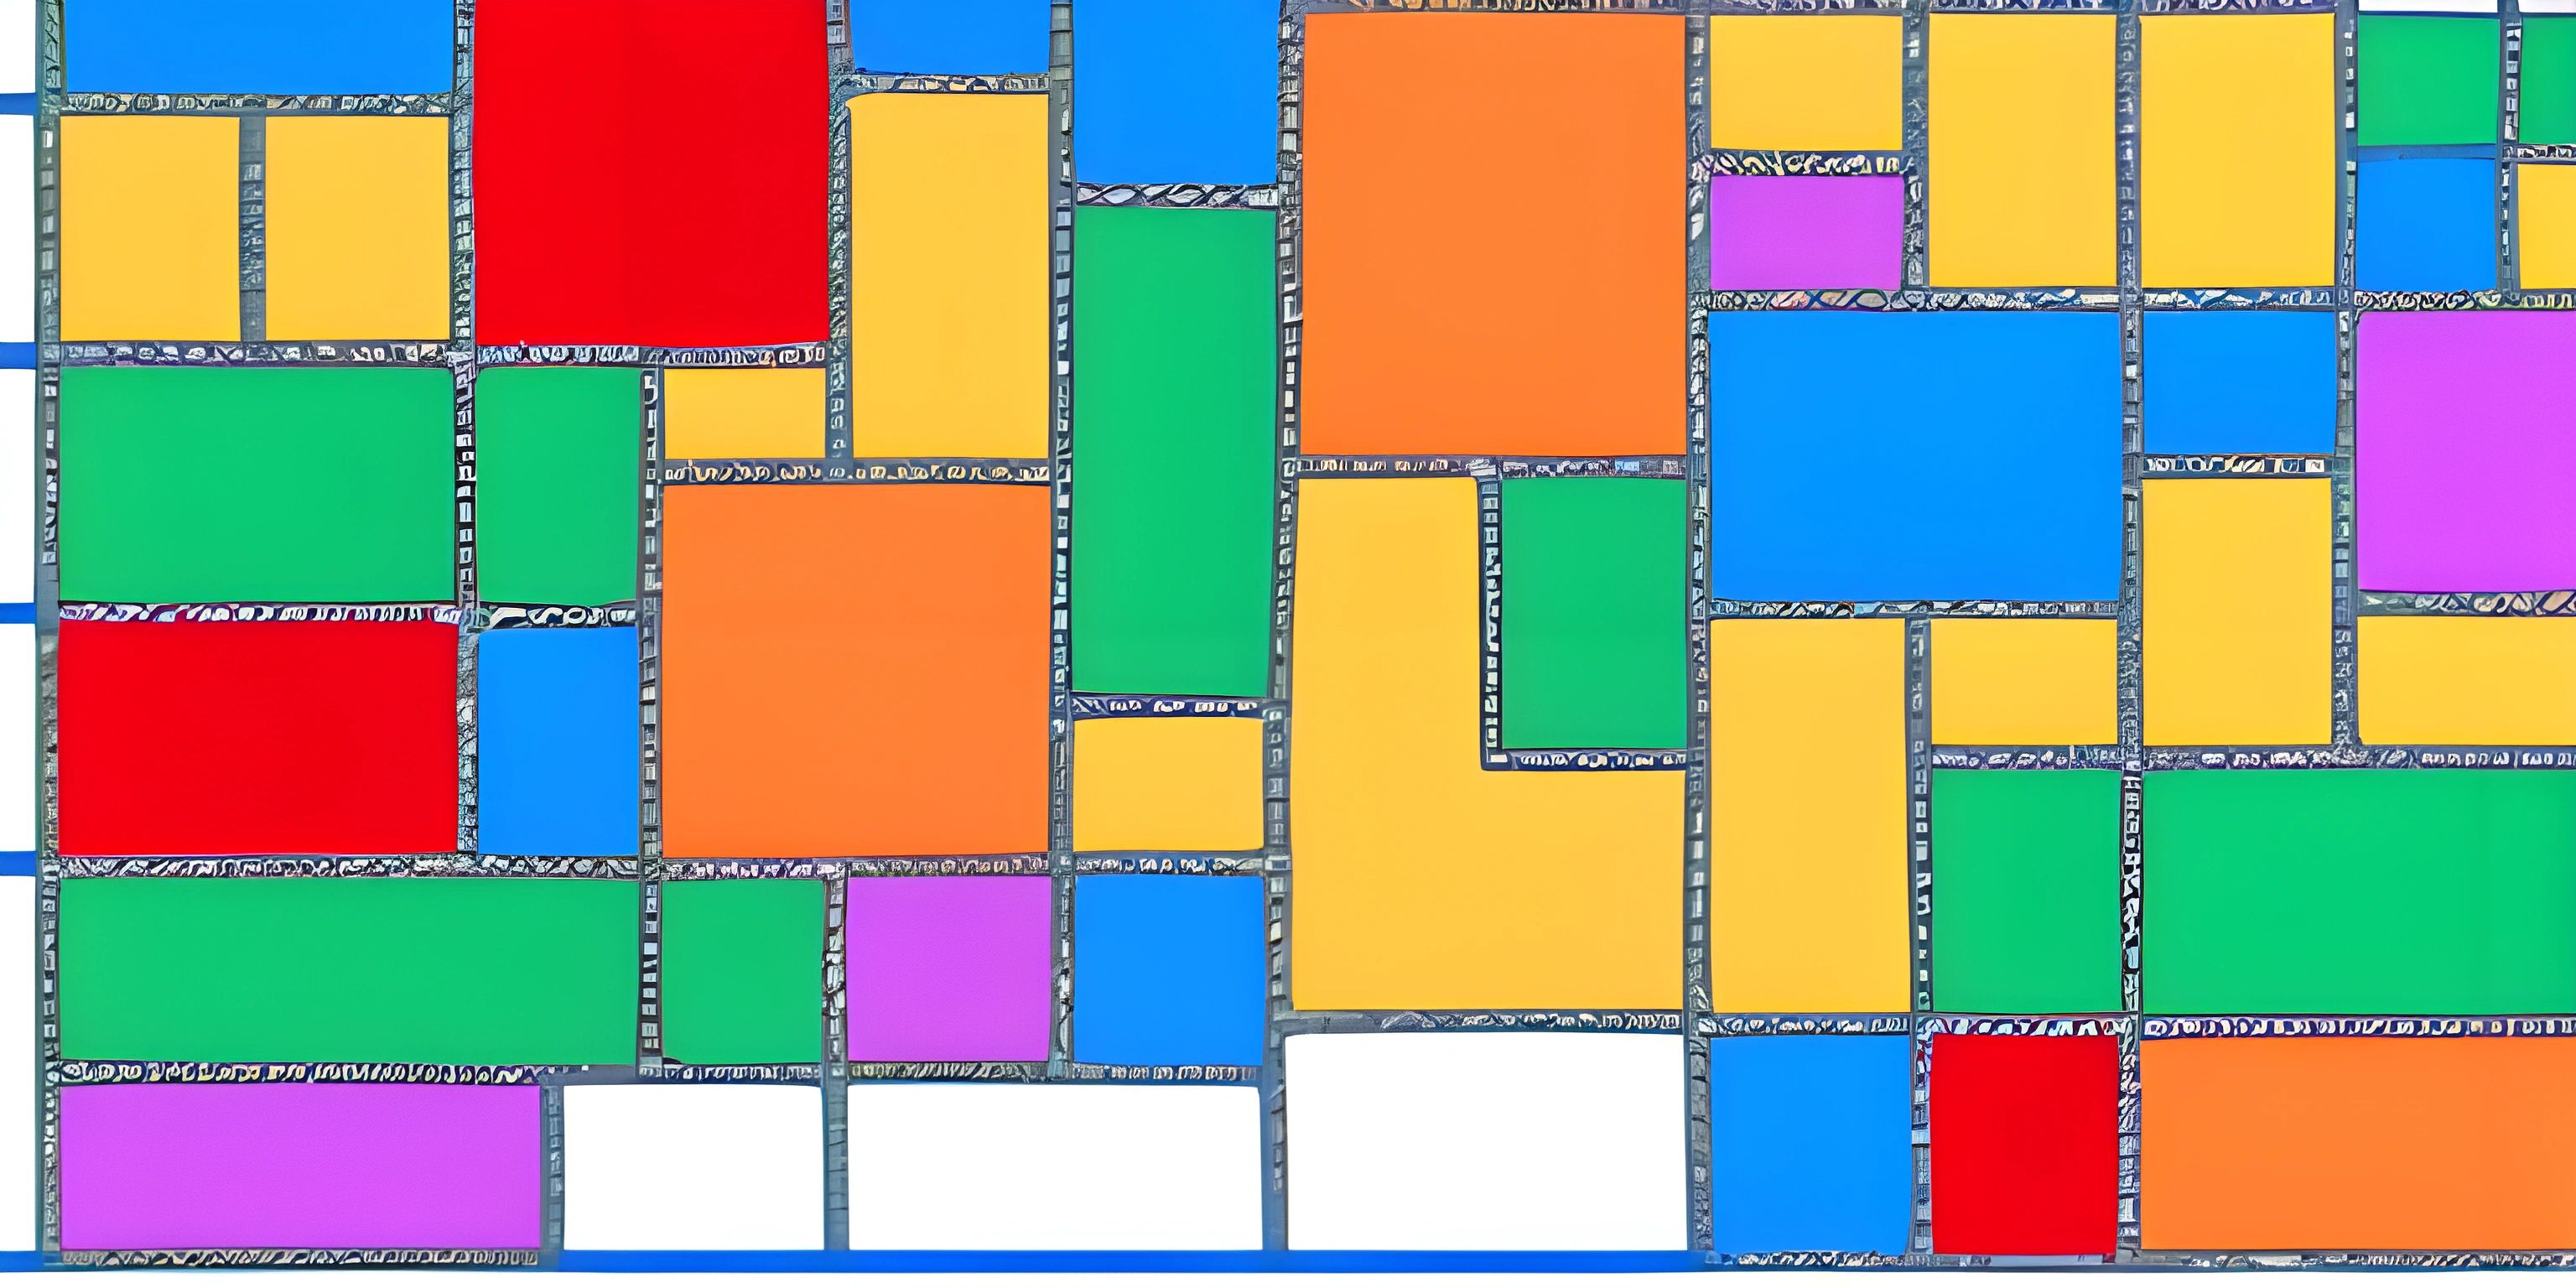
Learn how to create and customize contour plots in MATLAB, a powerful visualization tool for two-dimensional data.
Creating visualizations using MATLAB plotting functions.
Exploring the Processing environment and its capabilities for creative coding, visualization, and interactive applications.
An overview of available MATLAB colormaps and how to use them to enhance your plots and visualizations.